Introduction
Luang Prabang is a gorgeous heritage city in Laos, and it happens to not only be pleasant to walk around, but there’s an abundance of incredibly delicious northern Lao food for you to try.
It’s the type of city where you’ll find yourself just smiling while walking around because it’s so pleasant in every way. Luang Prabang is a hub of Northern Lao culture and food.
In this Luang Prabang travel guide for food lovers, you’ll find a list of authentic Luang Prabang restaurants, plus travel tips on where to stay and what to do in this friendly city.
Quick tips
Places I ate
Xieng Thong Phonsavahn Restaurant
The Mekong River fish dishes here are delicious. Don’t miss the “jaew kee pa,” a fish egg chili dip.
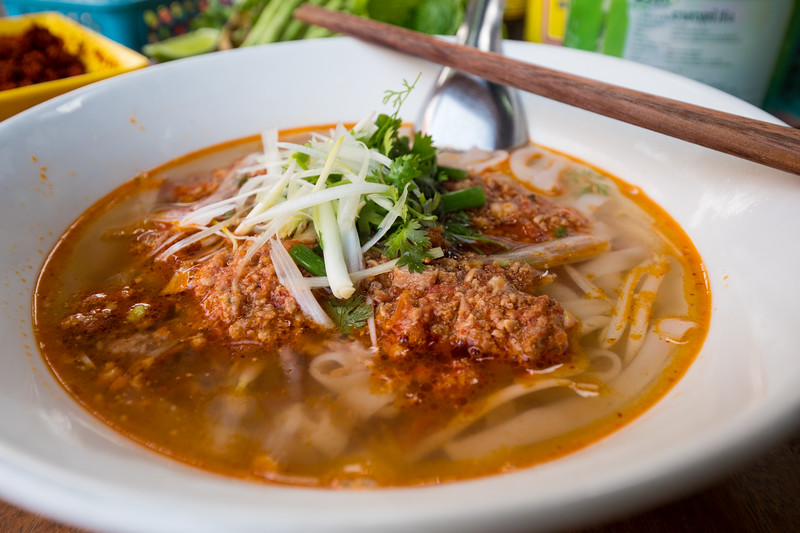
Khao Soi Wat Sen
One of the most legendary hold in the wall restaurants to eat Luang Prabang khao soi – a soft noodle tomatoey and minced meat soup.
Phamsai Houngchalern Restaurant
Excellent family restaurant where you can try a huge variety of local Luang Prabang and Lao dishes.
Where I stayed
Apple Guest House
Family run guesthouse located on a quiet walking only street, with very clean rooms, good service, and nice balcony.
Phounsab Guesthouse
One of the best things about this guesthouse is its location, just in front of the night market. Stayed here for a few night during my trip.
Busari Heritage Luang Prabang
A beautifully restored classic hotel in the heart of Luang Prabang. Also check out Mekong Riverview Hotel for ultimate peace and relaxation at the end of the peninsula.
Things I did
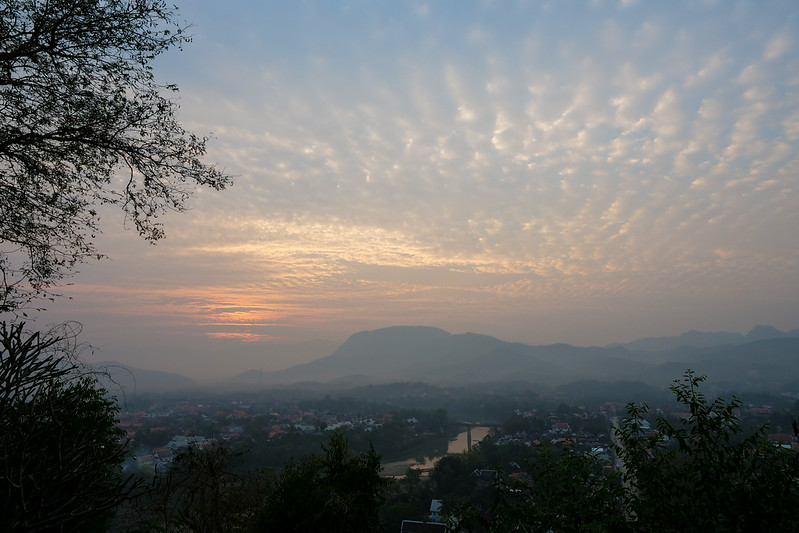
Mount Phousi
Climb to the top of this hill in Luang Prabang for a fantastic view of the city and surrounding rivers.
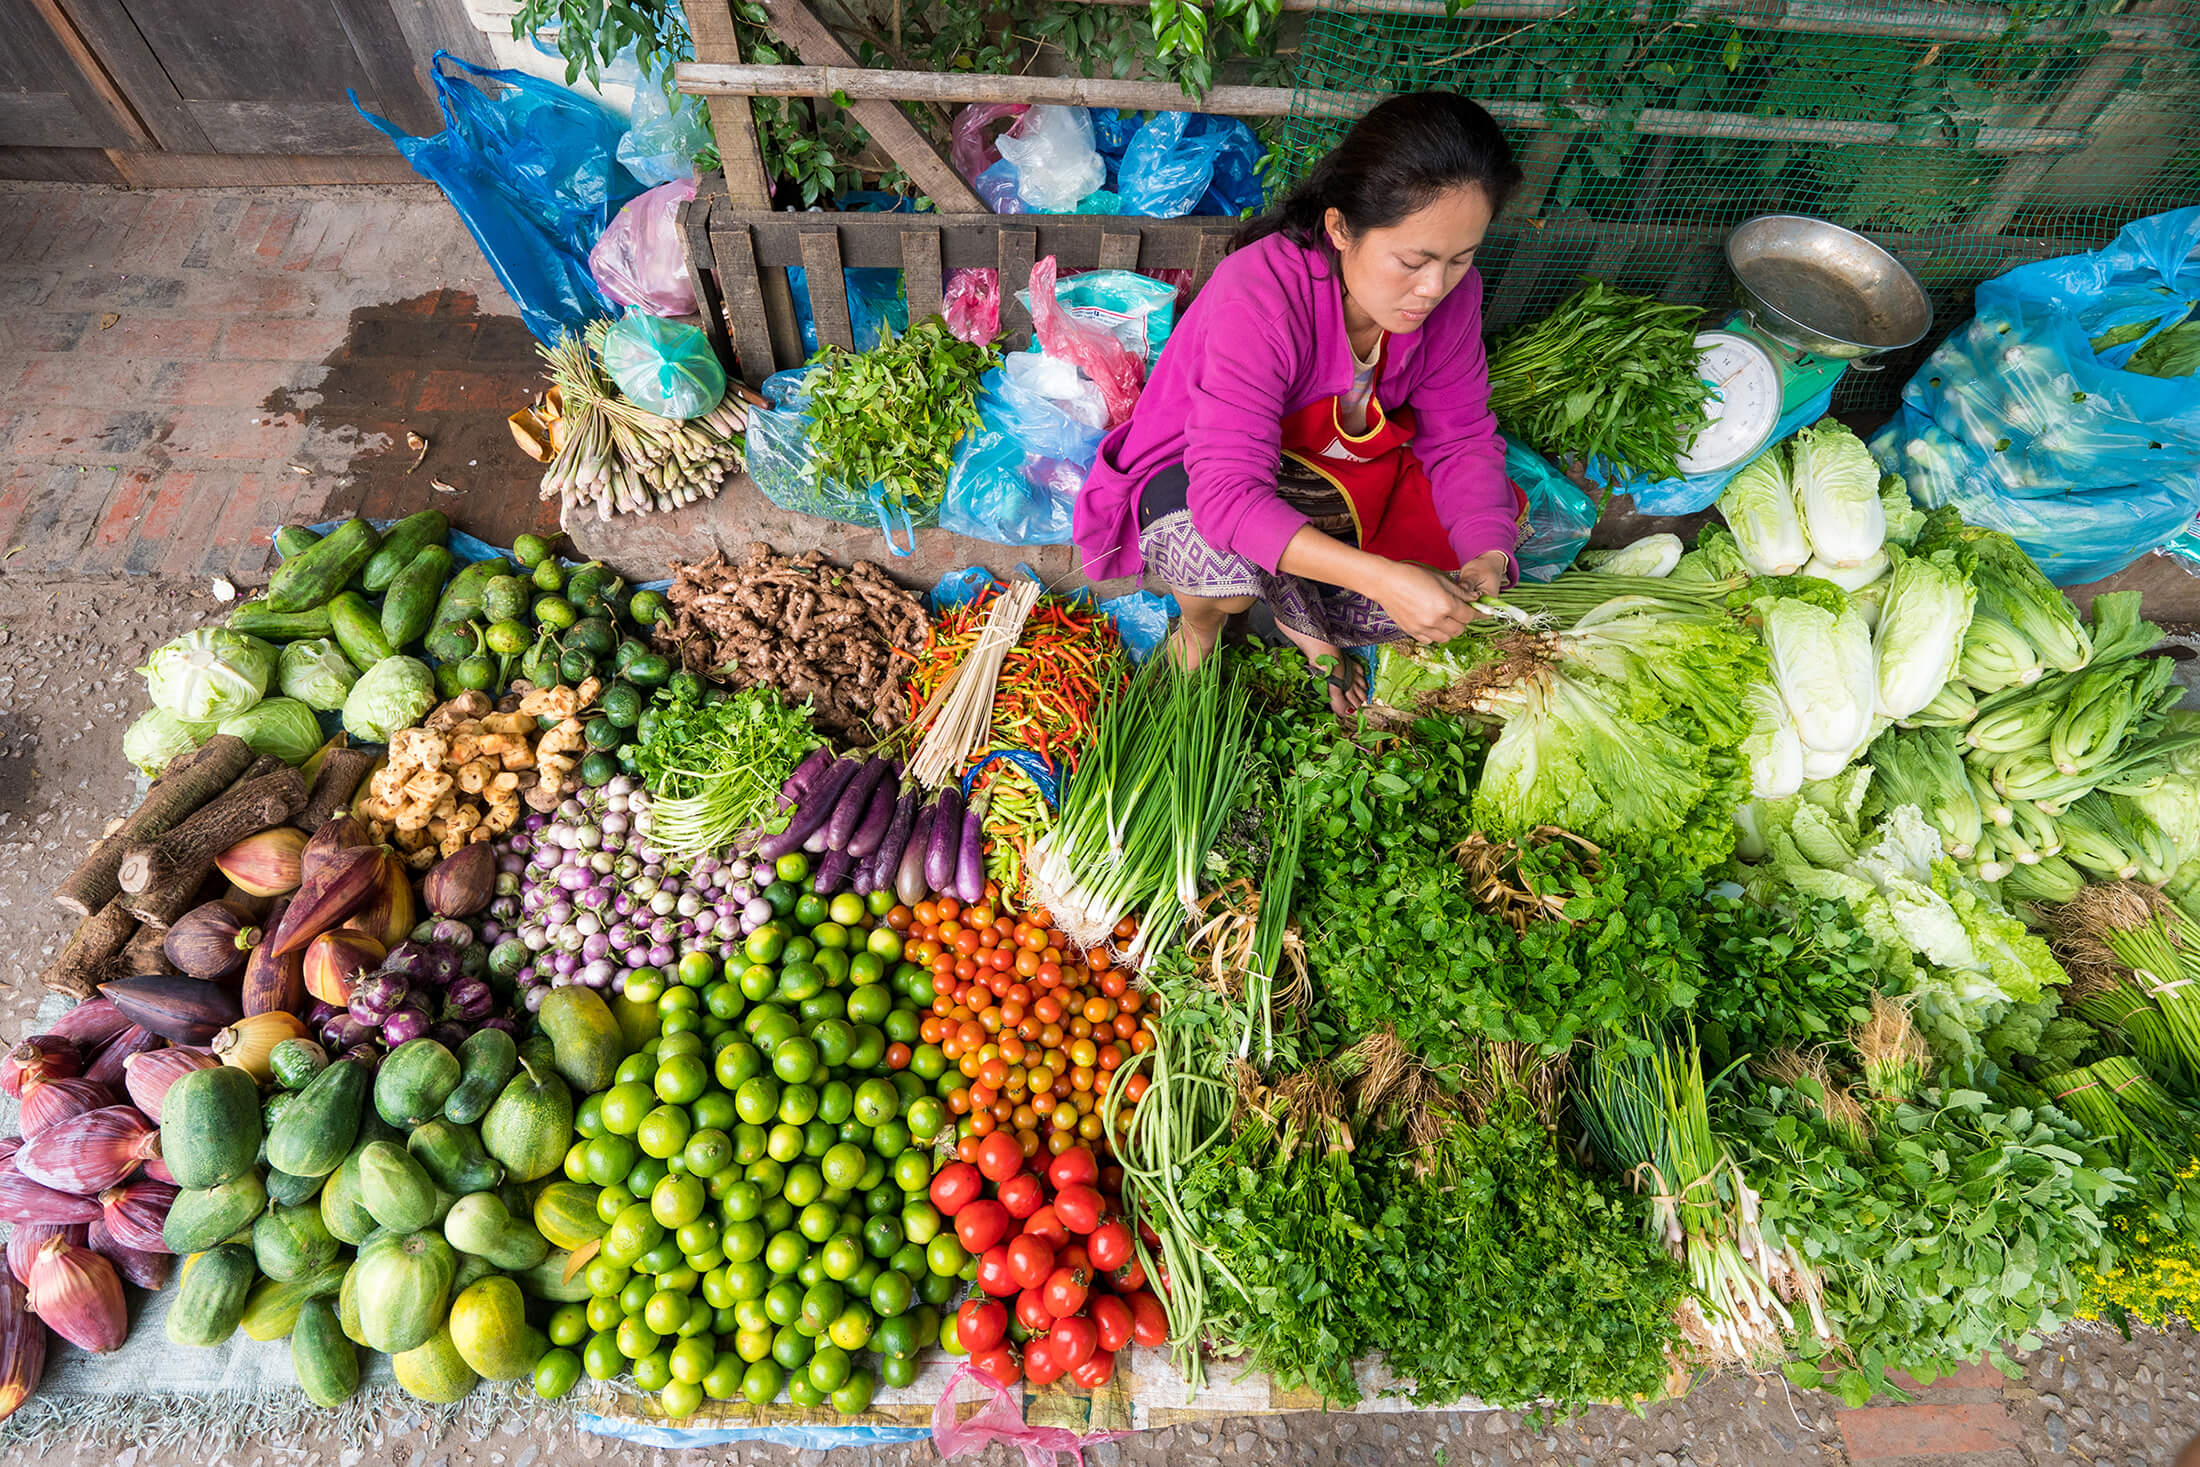
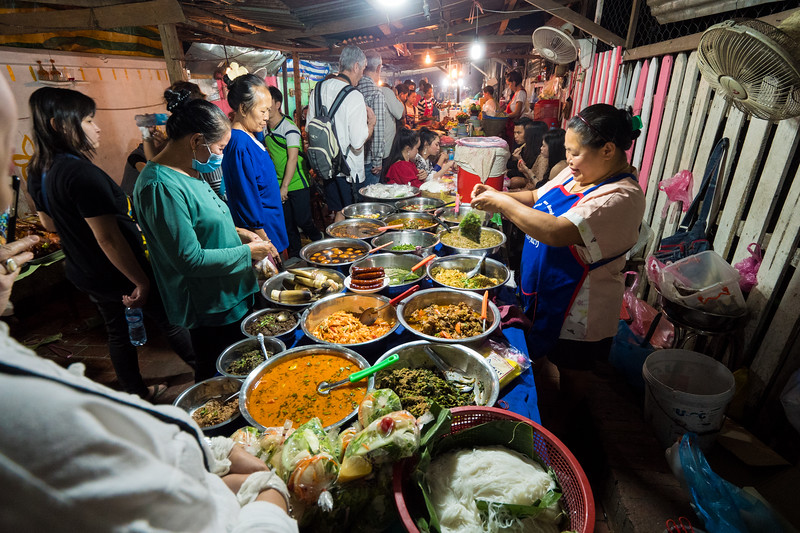
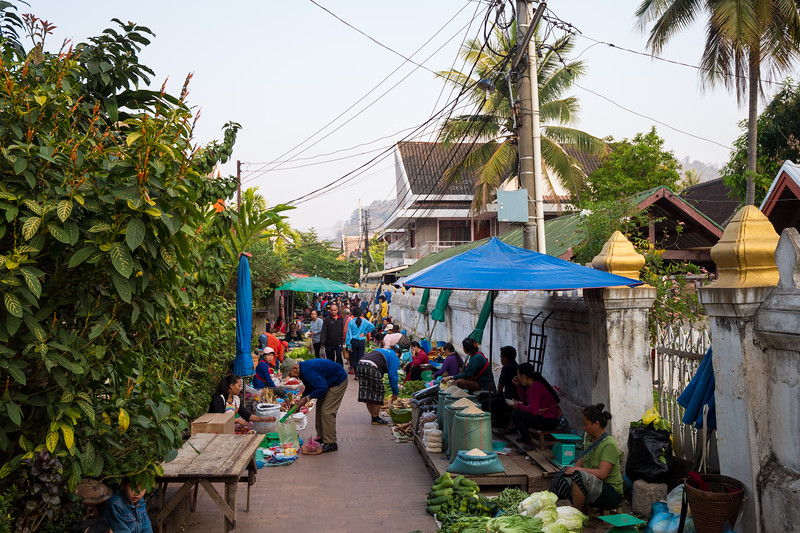
Luang Prabang morning market
One of the top relaxing locals markets in Southeast Asia. Unique ingredients, plus some amazing food to eat.
Wat Xieng Thong
An important Buddhist temple at the end of the peninsular in historical Luang Prabang.
Food overview
Luang Prabang, located in the northern part of Laos about 340 km north of the capital Vientiane, has its own distinct food culture and dishes.
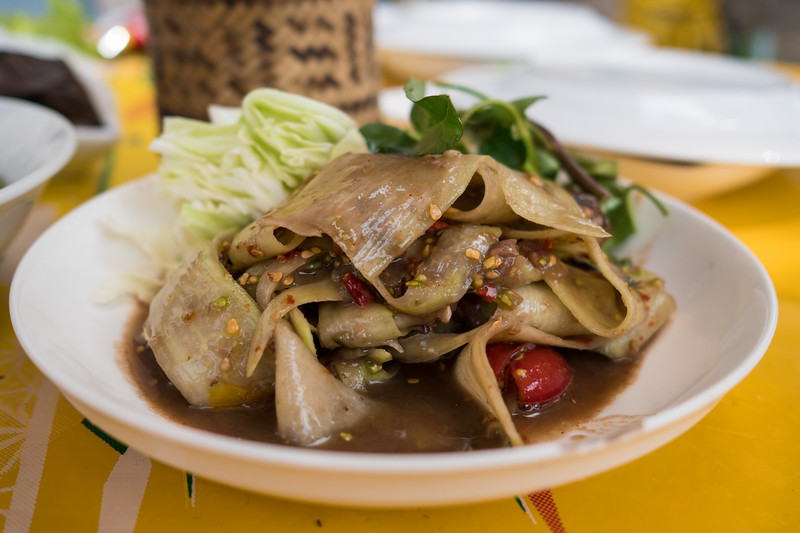
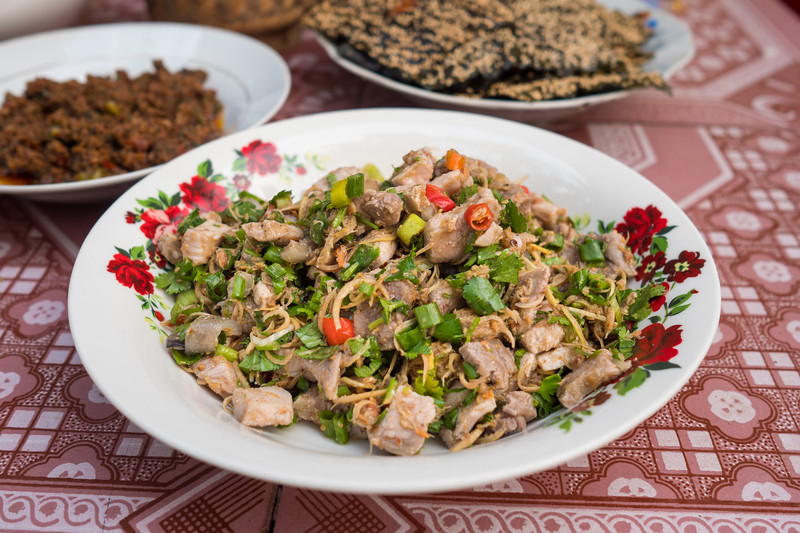
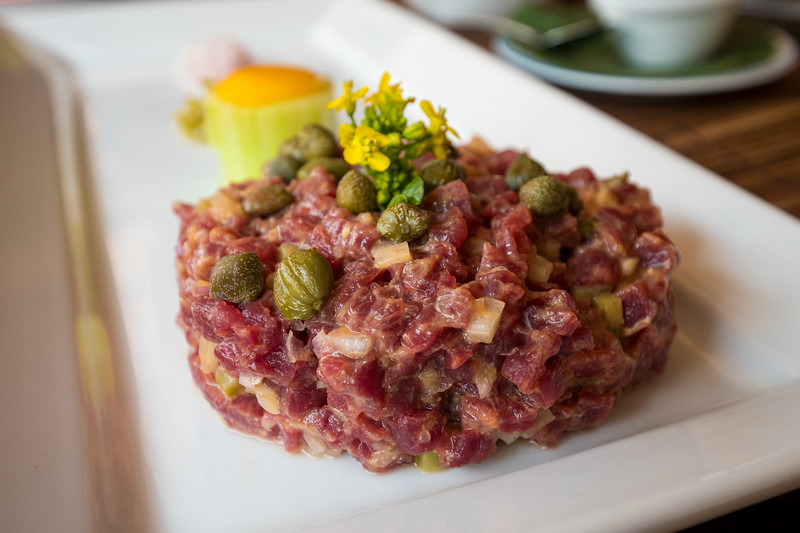
You’ll find some of the best green papaya salads in the country, a variety of stews that make use of unique Mekong river ingredients (like algae), mind blowing chili dips (jaew), and an abundance of fresh river fish that are made into soups, curries, and one the best dishes – koi (similar to Laotian laap).
Right on the center main street on the historic peninsula of Luang Prabang, you have to choose your restaurants wisely, as there are plenty of watered down Lao food restaurants. But slotted in between, and down alleys, you’ll be rewarded with local northern Lao restaurants that will impress your taste buds.
Restaurants & street food
Below are a list of the best restaurants and street food stalls I tried during my stay in Luang Prabang.
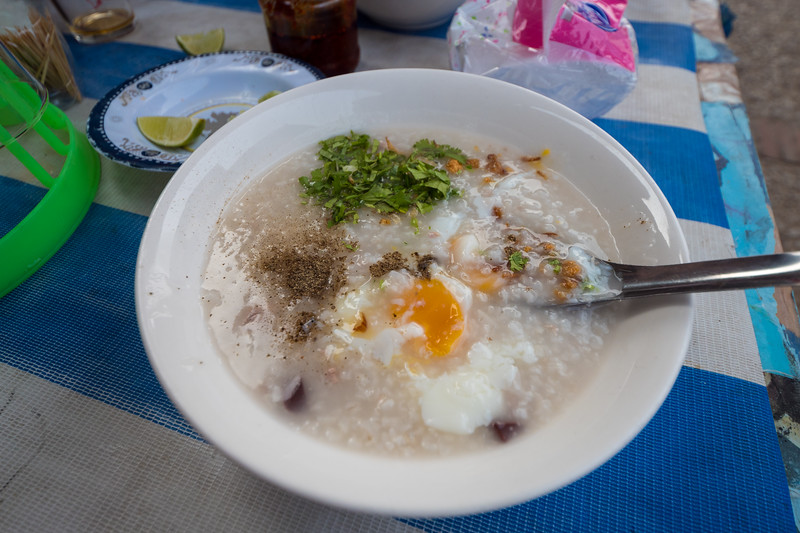
Morning porridge stall
Just opposite Sisavangvong Road from Luang Prabang’s morning market is an outside stall serving khao piak khao, and Lao version of rice congee. It’s really good, especially on a cool morning.
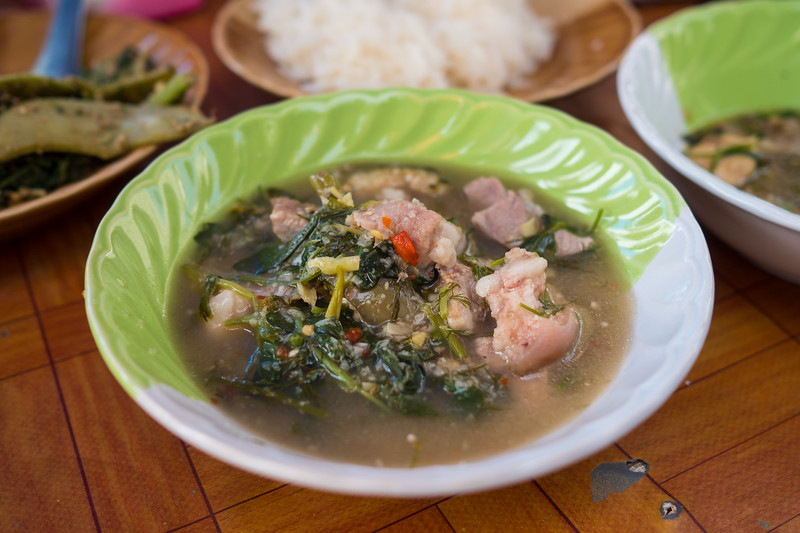
Stall across from That Luang Gas Station
We were just walking around exploring Luang Prabang when we stumbled into this awesome street food stall for lunch. They have about a dozen dishes you can order, including or lam (type of pork and herb stew) and or bon (taro leaves stew), and a series of jaews (chili dips).
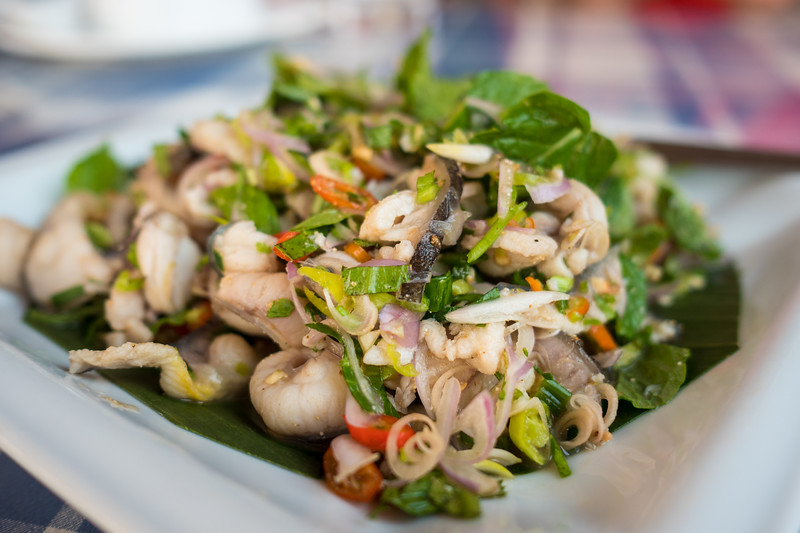
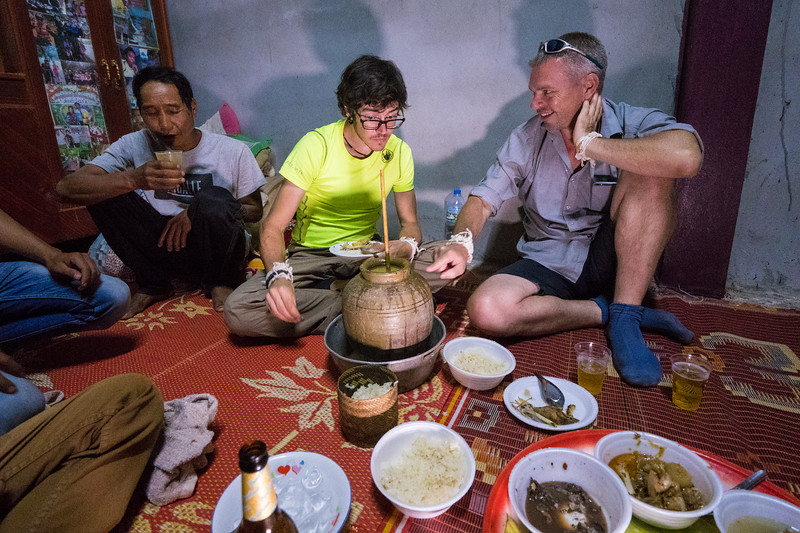
Xieng Thong Phonsavahn Restaurant
Located on the end of the Luang Prabang peninsula, this no-frills restaurant, that has seating on both sides of the road (the seating section overlooking the Mekong is great), serves what I think is one of the best meals you can eat in Luang Prabang. The owner serves a masterfull, “jaew kee pa,” – a chili dip with fish eggs, to which he said – “You haven’t been to Luang Prabang until you’ve eaten this.” It’s that good. This is my favorite restaurant mentioned in this Luang Prabang travel guide.
Things to do
With a mix of culture, history, well preserved building, and food, Luang Prabang was named one of the top cities to visit in 2018 by NY Times. In this Luang Prabang travel guide for food lovers, I’ve only included a short list of attractions, things that I personally did.
Check out my personal best Luang Prabang one day itinerary. Also, here are more daily itineraries by NY Times and The Guardian which are useful.
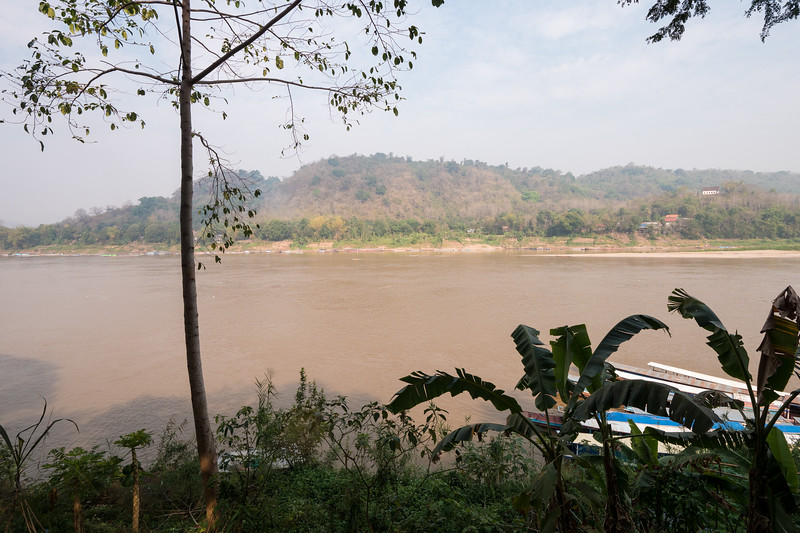
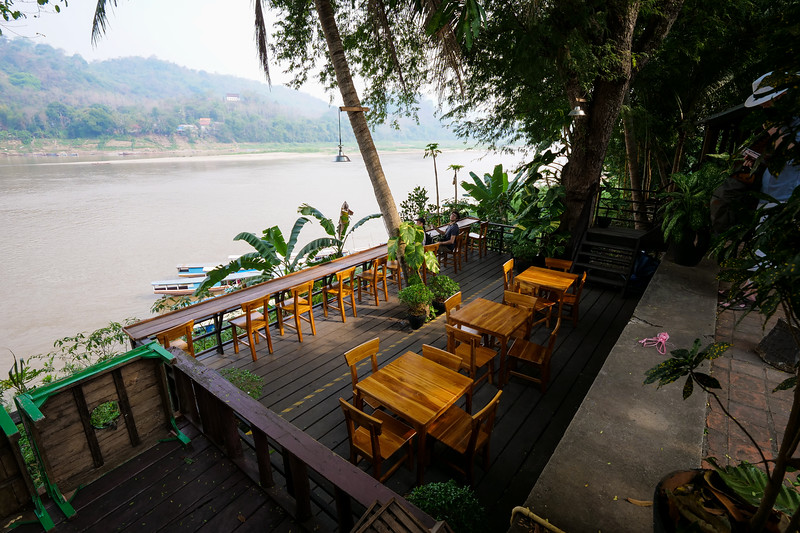
Relax riverside
One of the highlights of this Luang Prabang travel guide and things to do when you’re there, is simply to enjoy that you are in Luang Prabang. Stroll along the Mekong River, have a coffee, eat some food, slowly stroll again, eat a sausage, have a BeerLao, and so on, continuing this slow pace of life.
How to get around
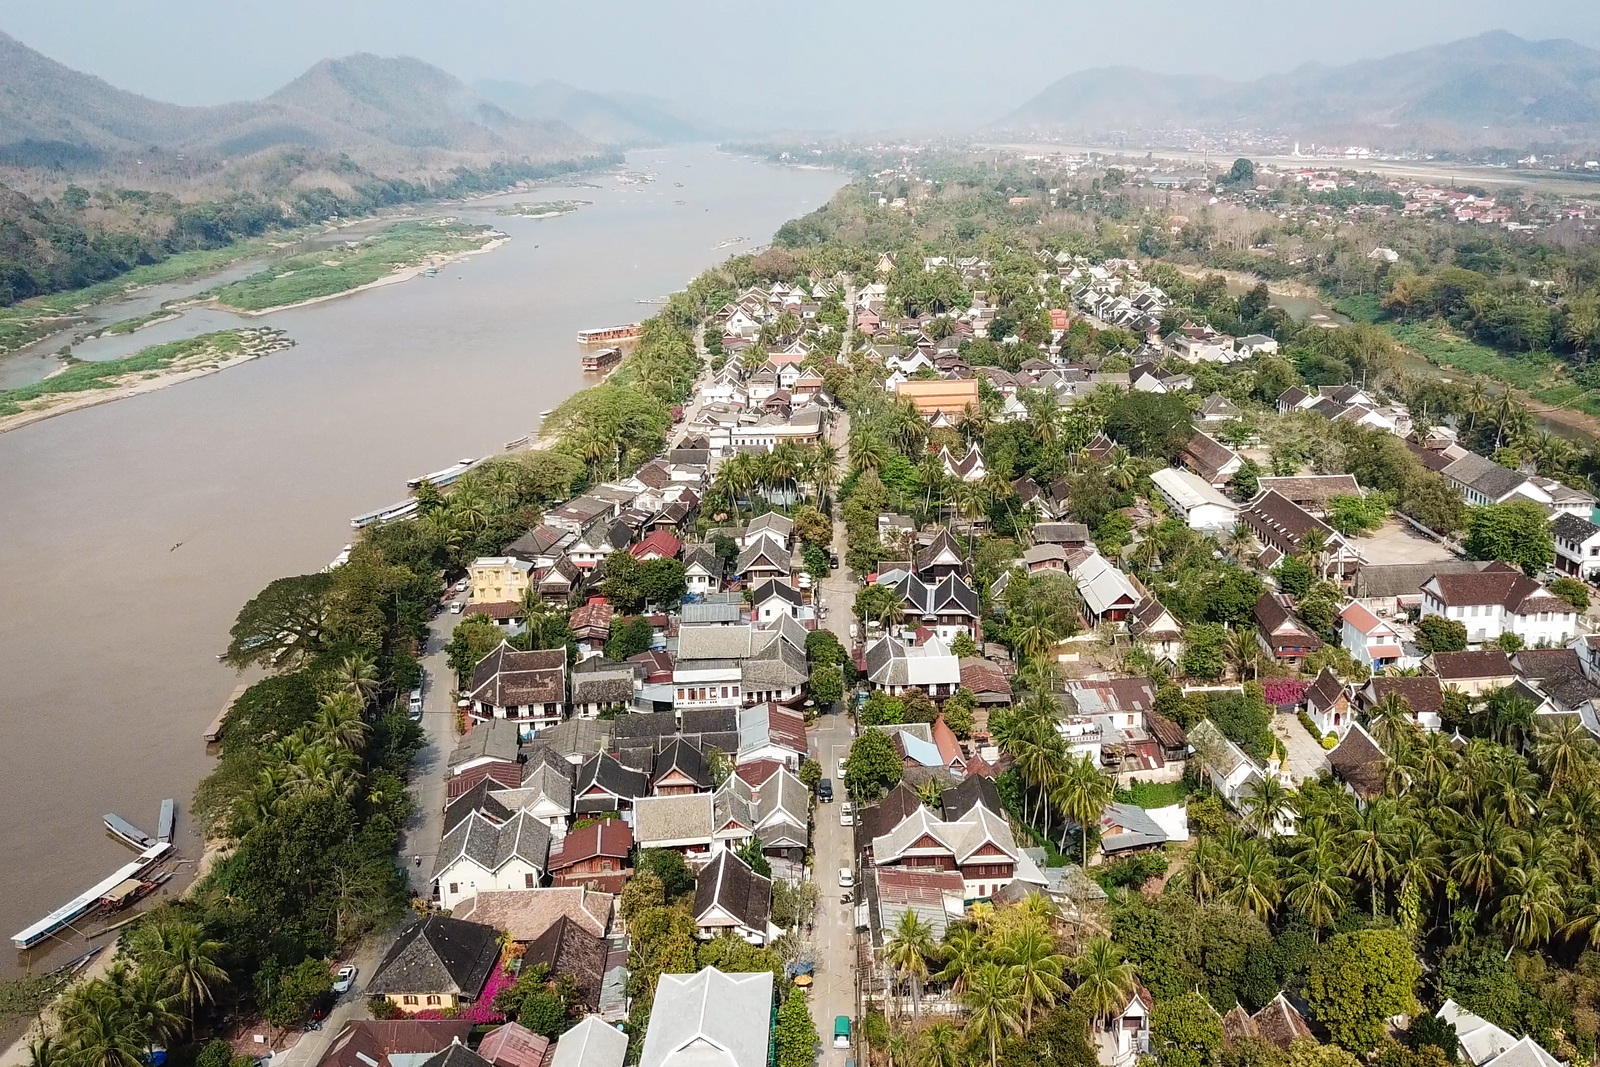
The center historical part of Luang Prabang is located on a peninsula, along the edge of the giant Mekong River and the Nam Khan River. The entire area is very walk-able, and actually extremely pleasant to walk around. Alternatively, bicycles are available for rent at many shops along the main road.
For getting other places in Luang Prabang city, like the airport, you can jump in the back of a tuk tuk (jumbo), although you have to negotiate how much it will cost.
Arriving & leaving
Luang Prabang International Airport is 4 km from the center of the city. On my latest trip to Luang Prabang, I flew in from Vientiane with Lao Airlines. It was a very short, but good flight.
The easiest way to get from the airport to your hotel is to take an official taxi – which actually is a shared van. You’ll see the sign for an official taxi as you exit baggage claim. For some odd reason they charge per 3 people – 50,000 Kip for 3 people to the city historic center. You’ll share the van with a few others, and the driver will drop you off directly at your hotel in the city.
Going back to Luang Prabang International Airport, usually your guest house or hotel can arrange a taxi or tuk tuk for you. If you get your own, negotiate a fair price, about 30,000 LAK.
Accommodation
Here are some of my recommendations for places to stay when you’re in Luang Prabang.
Videos
Check out the entire video series from this trip. You can watch the entire playlist on my YouTube channel.
A few extra tips
Luang Prabang – Did you know in Lao, it’s actually spelled and pronounced Luang Phabang, without the ‘R’. The old heritage center if Luang Prabang is a UNESCO World Heritage site.
Travel Credit Card – (this is mainly for USA citizens) – For my travels, I almost always use the Chase Reserve credit card. I really like it because it offers no foreign transaction fees and nice benefits, like airport lounges.
Travel Insurance – Since I’m living as an expat now, I have a different more long term overseas insurance. But if you’re traveling short term, insurance is important. I recommend World Nomads for their incredible service, and great plans.
Final notes
Luang Prabang is one of those cities that as soon as you arrive, a sense of ultimate relaxation overwhelms you, and you automatically start doing things at a slower pace.
It’s a city to enjoy walks by the Mekong River, eat incredible northern Lao food and even international food, and admire the beautiful buildings and temples.
In this Luang Prabang travel guide for food lovers, you’ll find all the best restaurants and street food I tried, plus tips on how to make the most of your stay. Hope you have an amazing trip and especially take time to enjoy the wonders of northern Laotian food!